Geographic Information Systems (GIS) Mapping Tools
 PA DEP's GIS open data portal provides access to all of our publicly published, non-sensitive GIS data, which includes over 300 data layers relative to abandoned mine lands, air quality, water pollution control, coal mining, hazardous waste, operations, oil & gas, streams and lakes, industrial minerals mining, integrated report, municipal waste, radiation, storage tanks, stormwater, Chapter 93, TMDLs, water resources, and more! Select a category by clicking on the data topics to the left or right, or use the search tool above to discover our data. You can connect directly to the data, download it, embed it in your own applications or share it!
 The Environmental Search Tool is a simplified version of the Environmental Site Assessment Search Tool that is intended to facilitate public access to information maintained in DEP’s eFacts database. A person may use the Environmental Search Tool to view DEP regulated activities within the vicinity of an identified location. Search results may identify the location of permitted activities, known contamination, and documented violations of the laws administered by DEP. The Environmental Search Tool is designed to give the public immediate access to information maintained by DEP and to minimize the circumstances where an interested party may need to schedule an appointment at the appropriate DEP office to review public records.
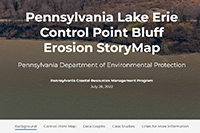 The Pennsylvania Bluff Recession and Setback Act and Chapter 85 Bluff Recession and Setback regulations require DEP to establish bluff recession hazard areas and develop minimum setback distances along Lake Erie. In order to accurately assess erosion hazards, the Coastal Resources Management Program established a control point monitoring program in the early 1980s. Approximately 130 fixed markers along the shoreline are assessed on four-year cycle to determine an overall rate of loss at each site in feet per year. Results of these 40+ years of monitoring are presented in the new Lake Erie Control Point Bluff Erosion StoryMap. This web application provides background information and an interactive map where users can view the location of monitoring points, historical aerial photographs, and erosion rates. The StoryMap also features graphs, downloadable datasets, and two case studies of sites experiencing recession along Pennsylvania’s Lake Erie coastline.
 "Looking Below the Surface" (the macroinvertebrate story map) is designed to inform and educate the public about PA DEP's benthic macroinvertebrate dataset. Not all streams and rivers are created equal, so DEP has developed unique macroinvertebrate collection methods for various stream types. DEP uses these differing methods to get a picture of water quality and ecosystem integrity. This story map touches on why benthic macroinvertebrates are so important and how they are used to measure water quality.
 Macroinvertebrates are used throughout the world as indicators of water quality. Macroinvertebrate community assessments are efficient and powerful because they offer the ability to assess short-term and long-term, cumulative effects of many ecosystem stressors, including both chemical and physical factors. To address the complexities of different types of streams and the macroinvertebrate communities that may prefer certain physical or chemical features, DEP has created three unique macroinvertebrate collection methods. This app will allow you to view and download macroinvertebrate and associated data collected across the state. These data can be exported into several file types including gif, jpg, pdf, png, xlsx, and csv. For instructions on using this viewer,
view our demonstration video.
Macroinvertebrates are used throughout the world as indicators of water quality. Macroinvertebrate community assessments are efficient and powerful because they offer the ability to assess short-term and long-term, cumulative effects of many ecosystem stressors, including both chemical and physical factors. To address the complexities of different types of streams and the macroinvertebrate communities that may prefer certain physical or chemical features, DEP has created three unique macroinvertebrate collection methods. This app will allow you to view and download macroinvertebrate and associated data collected across the state. These data can be exported into several file types including gif, jpg, pdf, png, xlsx, and csv. For instructions on using this viewer,
view our demonstration video.
 Learn about adverse human impacts on the East Coast's longest river and its tributaries and follow the progress of the Department of Environmental Protection's (DEP's) efforts to tackle them on a new interactive, multimedia website called the Susquehanna River Story. The Susquehanna River Story website uses GIS maps, videos, charts, and photos to show where mining, agriculture, stormwater, and dams have impaired macroinvertebrate, fish, and plant life, as well as DEP's progress in addressing these impairments. DEP research on smallmouth bass is also shared. Site visitors can see which streams have been impaired by farming activities as well as samples of agricultural best management practices that have been implemented to repair impacts and which streams have been impaired by acid mine drainage and locations of successful treatment projects.
 Municipalities and other entities such as universities and prisons that meet certain standards must obtain NPDES permit coverage for discharges of stormwater from their municipal separate storm sewer systems (MS4s). This new web mapping application allows the user to search for the municipality and see the urban area report, as well as the impaired streams.
 This interactive website has been designed to facilitate filling out forms for the PA Nutrient Credit Trading Program. Use it to identify surface waters and their basin, Chapter 93 water quality uses, and impairments (section 5.D. on the certification request form, sections 3 and 6 on the registration request form).
 eMapPA is a GIS based website and mapping tool that focusses on the display of environmentally relevant data to Commonwealth Agencies, contractors and the public. In addition to DEP-permitted facilities, there are over 50 map layers relating to administrative and political boundaries, culture and demographics, geology, mining, streams and water resources, and transportation networks. Tools for navigating, querying, identifying, extracting, buffering, and address matching are available for GIS analysis. All of the tools and their uses are fully explained in the Help option on the menu bar. For security reasons, information regarding Dams, Explosive Storage Locations, Public Water Supplies, and certain Water Pollution Control, Water Resource, and Radiation Facilities are not displayed on eMapPA. Permit information, inspections, and other data related to these facilities can be obtained by contacting the appropriate DEP Office.
eMapPA enables the userto identify sensitive data and non-sensitive data attributes located near aproposed project without showing the water source locations or coordinates. Also, eMapPA can assist permittees/applicants who are required to develop DownStream Notification Lists. To obtain sensitive and non-sensitive data, click on these
eMapPA instructions. For instructions on how to extract water quality data and resources from eMapPA,
view our demonstration video.
 This interactive website shows the location of both conventional and unconventional oil and gas wells, including producing and non-producing wells, based on information from operator submitted reports. The user can request this data set to display information based on the permit number, combinations of operator that submitted the report, the county in which the well is located or the municipality (also known as Minor Civil Division or MCD) in which the well is located. The user also has the ability to use map functionality to locate a specific address, county, latitude and longitude, municipality or zip code. Please note that only wells which have locational information and are located within the boundaries of Pennsylvania will be available.
For best results, Internet Explorer should be used when viewing the Oil and Gas Mapping website. For use instructions, watch the YouTube tutorial
DEP Oil and Gas Well Mapping Application
This interactive website shows the location of both conventional and unconventional oil and gas wells, including producing and non-producing wells, based on information from operator submitted reports. The user can request this data set to display information based on the permit number, combinations of operator that submitted the report, the county in which the well is located or the municipality (also known as Minor Civil Division or MCD) in which the well is located. The user also has the ability to use map functionality to locate a specific address, county, latitude and longitude, municipality or zip code. Please note that only wells which have locational information and are located within the boundaries of Pennsylvania will be available.
For best results, Internet Explorer should be used when viewing the Oil and Gas Mapping website. For use instructions, watch the YouTube tutorial
DEP Oil and Gas Well Mapping Application
Integrated Water Quality Report Maps
 This interactive web mapping application shows the location of impaired and attaining streams in Pennsylvania, which corresponds to the Integrated Water Quality Monitoring and Assessment Reports. In addition, it will allow the user to see the impairment sources and causes, the category, the date listed, TMDL information, the stream names, and much more! It also allows you to print or export the information into a pdf. The user can search data based on stream name and assessment ID. The user also has the ability to use map functionality to locate a specific address, county, latitude and longitude, municipality or zip code.
2016 Integrated Water Quality Report Map
2018 Integrated Water Quality Report Map
2020 Integrated Water Quality Report Map
2022 Integrated Water Quality Report Map
2024 Integrated Water Quality Report Map
 Oil and Gas development in Pennsylvania has been ongoing for over 150 years. Regulatory standards for the industry have evolved significantly during this time period as a function of both advances in technology and a more intense focus on environmental protection. Materials and techniques historically used for well plugging are inadequate by today's standards. Additionally, because oil and gas development had been taking place for nearly a century prior to permitting requirements enacted in 1955, it is estimated that somewhere between 100,000 and 560,000 wells are yet to be accounted for. This story map overlays a historical oil and gas legacy development map (1930-1960s) over Allegheny County along with the Department of Environmental Protection known well inventory.
 The Pennsylvania Water Quality Network (WQN) is a statewide, fixed station water quality sampling system operated by Department of Environmental Protection's (DEP) Bureau of Clean Water (BCW). It is designed to assess both the quality of Pennsylvania's surface waters and the effectiveness of the water quality management program. This new web mapping application allows the user to search for WQN information by stream, by station ID and location, and it shows the location and information about reference stations, stormwater sediment stations, standard stations and macroinvertebrate stations.
 DEP launched a web mapping application for the 2016 Integrated Report that consisted of Category 5 priority waters. This map includes waters proposed for restoration alternatives and high priority impaired waters requiring a TMDL. This app will allow you to locate these waters and information regarding the watershed and reason why it was listed as either a high priority for TMDL development or restoration alternative (5alt). This application only includes the sources and causes of impairment addressed with the TMDL or alternative plan and other sources and causes of impairment may be linked to these waters and will be addressed later.
 The Pennsylvania Activity and Use Limitation (PA AUL) Registry website provides the public with information on properties within Pennsylvania that have some form of use restriction or ongoing obligation associated with a remediation. The Uniform Environmental Covenants Act (UECA) requires DEP to maintain a registry of properties with environmental covenants. The PA AUL Registry meets this requirement by including properties with environmental covenants, deed restrictions, post remediation care plans or any other AUL document. Searches for properties with AULs can be performed using the map on the website or by searches on address, zip code, county or other criteria. Once a property of interest has been located it is possible to view any AUL documents that have been associated with that property.
For best results, Internet Explorer should be used when viewing the PA-AUL website.
The Pennsylvania Activity and Use Limitation (PA AUL) Registry website provides the public with information on properties within Pennsylvania that have some form of use restriction or ongoing obligation associated with a remediation. The Uniform Environmental Covenants Act (UECA) requires DEP to maintain a registry of properties with environmental covenants. The PA AUL Registry meets this requirement by including properties with environmental covenants, deed restrictions, post remediation care plans or any other AUL document. Searches for properties with AULs can be performed using the map on the website or by searches on address, zip code, county or other criteria. Once a property of interest has been located it is possible to view any AUL documents that have been associated with that property.
For best results, Internet Explorer should be used when viewing the PA-AUL website.
 There are known contaminant plumes affecting groundwater at various locations in Williamsport. Within these areas, if a well is to be allowed, additional sampling requirements are necessary to insure contaminated groundwater would not be used. To see if the proposed well is located in a plume, use this interactive mapping application to enter the latitude and longitude of the well. If the well resides in a contaminated location, a list of contaminants of concern (COC) and additional required sample parameters will be displayed.
Geographic Information Systems (GIS)
Browse related links for the Department of Environmental Protection's partners in the Geographic Information System community. For specific GIS questions,
contact the Geospatial Data Center.
Related GIS Links
Below are links to other valuable GIS Information.
-
Geospatial Technologies operations office (GTOO) The Geospatial Technologies Office develops the Geospatial Enterprise Architecture for Pennsylvania, enhances the Commonwealth's geospatial preparedness, coordinates Executive agency and enterprise geospatial initiatives, and facilitates geospatial interoperability and data sharing across all levels of government in support of defined Pennsylvania priorities and the National Spatial Data Infrastructure (NSDI).
-
PASDA Pennsylvania Spatial Data Access (PASDA) is the official public access geospatial information clearinghouse for the Commonwealth of Pennsylvania and has served for fifteen years as Pennsylvania's node on the National Spatial Data Infrastructure, Geospatial One-Stop, and the National Biological Information Infrastructure. PASDA was developed by the Pennsylvania State University as a service to the citizens, governments, and businesses of the Commonwealth. PASDA is a cooperative project of the Governor's Office of Administration, Office for Information Technology, and the Penn State Institutes of Energy and the Environment of the Pennsylvania State University. Funding and support is provided by the Pennsylvania Office for Information Technology. In addition, PASDA also receives substantial support from the Pennsylvania State University. Most of PADEP's public GIS data sets are available for use from PASDA.
-
Keystone GIS is an organization that is devoted to the furtherance of GIS in Pennsylvania. Their site contains information on meetings, events and issues that focus on geographic information systems.
-
Federal Geographic Data Center The Federal Geographic Data Committee coordinates the development of the National Spatial Data Infrastructure (NSDI). The NSDI encompasses policies, standards, and procedures for organizations to cooperatively produce and share geographic data. The 16 federal agencies that make up the FGDC are developing the NSDI in cooperation with organizations from state, local and tribal governments, the academic community, and the private sector.
-
United States Geological Survey (USGS)The USGS serves the Nation by providing reliable scientific information to: describe and understand the Earth; minimize loss of life and property from natural disasters; manage water, biological, energy, and mineral resources; and enhance and protect our quality of life. They are also a great source for maps and information.