East Erie Benzene Monitoring Project
Monitoring Background:
In August of 2017, Erie Coke Corporation applied to renew its Title V Air Quality Operating Permit. As part of the review process for the application, the Pennsylvania DEP established a local stakeholder group to identify community concerns and issues regarding the operation of the facility. One of the concerns identified by the stakeholder group was the lack of any information regarding the impact benzene emissions from Erie Coke are having on the local neighborhood.
About the monitoring:
On July 17, 2019, the Pennsylvania Department of Environmental Protection installed a network of 13 passive air quality sampling units near the perimeter of Erie Coke Corporation and throughout the East Erie Community to determine the levels of benzene at the fence line of Erie Coke as well as within the nearby community. Nine monitors were placed in locations along Erie Coke’s property boundary between facility and the community. Four additional monitoring locations were established throughout the community. DEP also established a meteorological tower at the Erie Wastewater Treatment Plant to provide data on wind speed and direction, temperature and other items needed to assist in interpreting the results.
The passive sampling program is modeled after the same program used by many petroleum refineries which are required to implement fence line monitoring requirements. The monitors consist of passive sorbent sampling tubes designed to determine the concentrations of benzene, toluene, ethyl benzene, and xylene at the sampling sites.
The sampling is conducted 24 hours a day, seven days a week. Every two weeks, the tubes are collected, and new tubes are placed within the sampler. Sampling is planned to continue for one year from the start date of the sampling.
The data collected from the sampling effort will be used by state and federal agencies to provide a public health evaluation of the potential impacts that benzene in the local community has on the population which resides and lives there.
Understanding the data:
The federal Agency for Toxic Substances and Disease Registry (ATSDR) has evaluated available human and animal toxicity studies for benzene inhalation exposure and establish a minimal risk level for chronic benzene exposure of 9.6 µg/m3 (micrograms per cubic meter) for non-cancer health effects.
DEP has established an action value of 1.3 µg/m3 which represents an additional cancer risk of one in one hundred thousand people based upon U.S. Environmental Protection Agency’s reference concentration for benzene.
Important Information in Understanding Minimal Risk Level and Reference Concentrations:
- Airborne concentrations of a pollutant that are below the minimal risk level or reference concentration are unlikely to cause harmful effects in humans.
- Airborne concentrations that are greater than a MRL or RfC
do not automatically mean there is a public health hazard caused by the emissions, but rather, that further evaluation and analysis is needed.
- There are many potential causes of a sample result above DEP’s action value of 1.3 µg/m3 and exceeding the action value does not, in of itself, represent a violation for an applicable requirement or permit condition by Erie Coke.
- If sampling results exceed the action level for three sampling events in a rolling 90-day period, DEP will investigate to determine what specific activities in the area of Erie Coke, on or about the sampling period, could have caused the increased concentration level.
- DEP, the Pennsylvania Department of Health and ATSDR will review the data collected throughout the year to determine if there is a potential for acute health effects. In addition, once sampling is completed, a full health assessment will be completed by the health agencies to determine if there is a potential for health effects in the community.
Data Results:
DEP will update this table upon receipt of the test results for each sampling period.
|
Sample Period |
Data Report |
Map |
Meteorological Data |
| July 17 – July 31, 2019 |
Lab Report |
Map |
Met Data |
| July 31 – August 14, 2019 |
Lab Report |
Map |
Met Data |
| August 14 – August 28, 2019 |
Lab Report |
Map |
Met Data |
| August 28, 2019 – September 11, 2019 |
Lab Report |
Map |
Met Data |
| September 11, 2019 - September 25, 2019 |
Lab Report |
Map |
Met Data |
| September 25, 2019 - October 5, 2019 |
Lab Report |
Map |
Met Data |
| October 9, 2019 - October 23, 2019 |
Lab Report |
Map |
Met Data |
| October 23, 2019 - November 6, 2019 |
Lab Report |
Map |
Met Data |
| November 6, 2019 - November 20, 20191 |
Lab Report |
Map |
Met Data |
| November 20, 2019 - December 4, 2019 |
Lab Report |
Map |
Met Data |
| December 4, 2019 - December 18, 2019 |
Lab Report |
Map |
Met Data |
| December 18, 2019 - January 2, 2020 |
Lab Report |
Map |
Met Data |
| January 2, 2020 - January 15, 2020 |
Lab Report |
Map |
Met Data |
| January 15, 2020 - January 29, 2020 |
Lab Report |
Map |
Met Data |
| January 29, 2020 - February 12, 2020 |
Lab Report |
Map |
Met Data |
| February 12, 2020 - February 26, 2020 |
Lab Report |
Map |
Met Data |
| February 26, 2020 - March 11, 20202 |
Lab Report |
Map |
Met Data |
| March 11, 2020 - March 31, 20203 |
Lab Report |
Map |
Met Data |
| March 31, 2020 - April 8, 20204 |
Lab Report |
Map |
Met Data |
| April 8, 2020 - April 22, 2020 |
Lab Report |
Map |
Met Data |
| April 22, 2020 - May 6, 2020 |
Lab Report |
Map |
Met Data |
| May 6, 2020 - May 20, 20205 |
Lab Report |
Map |
Met Data |
| May 20, 2020 - June 3, 2020 |
Lab Report |
Map |
Met Data |
| June 3, 2020 - June 17, 2020 |
Lab Report |
Map |
Met Data |
1 Special note regarding Benzene Sampling Results for November 6, 2019 – November 20, 2019:
On November 10, 2019, Sampler No. 03 was found to be tipped over and damaged. The passive sampling tube had been removed from the shelter and was found lying on the ground nearby. The shelter was reinstalled and the tube placed back into the shelter. While DEP has reported the result from this location for this sampling period for transparency; the Department has created a field event notation for the sample result during this time period and the uncertainty resulting from the field event should be evaluated when determining whether or not to use the sample result.
2 A Chain of Custody error was identified with the deployment of the field sample and duplicate sample deployed at Sampler 01. An investigation determined the sample tubes had been mistakenly replaced into the sampler after harvest instead of inserting fresh sampling tubes. Please see the lab sample report regarding the validity of the results for this sampling period.
3The data for sampler 01 was not reported this period due to the sampling tube placement error identified during the previous sampling round. In addition, due to office closure and re-evaluation of testing protocols in response to the COVID-19 Emergency, the sampling period lasted for 20 days rather than 14 days. While the sampling period is outside of the reference methodology used for refinery monitoring, the Department believes the data is indicative of the benzene levels measured over the longer sampling period. See the lab report for additional information regarding the validity of the results due to the missing field duplicate.
4Due to the extended sampling times identified in the previous sampling period in response to the COVID-19 emergency; this sample period is shorter than normal in order to re-establish the correct sampling schedule. Most of the results in this round of sampling are identified in the lab reports as estimated values because the results were below the method detection limit for the sampling period. The lab reports also list the results with a D qualifier to indicate the shorter sampling period.
5Sample location No. 8 is reported as NR (No Result) during this sample period because the sampling unit had been tampered with and the sample tube was missing from the unit.
The sample report also includes sample results for a duplicate sample (represented by a “D” at the end of the sample ID and a trip blank (represented by a “B” at the end of the sample ID). Those results are included for quality assurance purposes and are not indicated in the sample results identified on the map.
Sample results for locations DEP ECP 03, 04, and 05 are represented with a NR (No Results) for the July 17 – July 31, 2019 sample period because deployment of the samplers was delayed briefly until the completion of an access agreement with the property owner.
During the period July 17 – July 31, 2019, sampler DEP ECP 13 was located at DEP’s COPAMS station at 10th and Marne in the City of Erie. Sampler DEP ECP 13 was moved to East Middle School at the start of the second sampling period.
The sampling point and results for DEP ECP 13 are not shown on the map due to the scale of the map used for readability purposes. Results for DEP ECP 13 are included in the lab report.
Interpreting the Map:
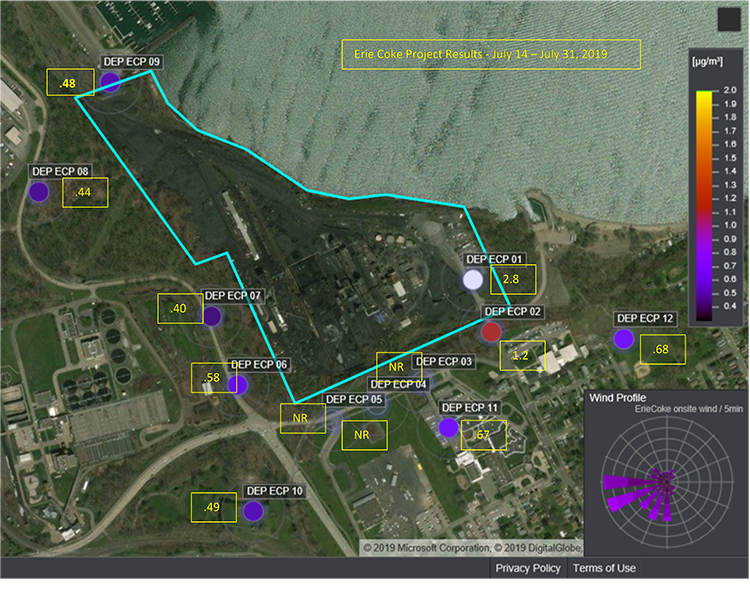
The map for each week includes a scale on the right side of the map, 12 of the 13 sample locations, results for each sample point and a wind profile chart. The 13th sample location is at the East Middle School located southeast of the plant and off the map.
The scale is designed to provide values above and below DEP’s established action value for this project. The dots on the map are color coordinated with the scale. Dots colored orange, yellow or white indicate values at or above the action value. Dots colored red, purple or blue indicate values below the action value.
A wind profile chart is also included on the map. The spikes on the map represent the wind direction and frequency the wind was originating from during the sampling period. The longest spike represents the wind direction the wind was blowing from in the highest frequency during the sampling period, i.e., the longer the spike; the longer the wind was blowing from that direction.