Drinking Water Program Performance Measures
Water Standards and Facility Regulation Performance Measures
Introduction
In the Department of Environmental Protection (DEP), the Bureau of Water Standards and Facility Regulation administers Pennsylvania's drinking water program. Additionally, DEP's Field Operations Deputate implements the program at the field level. The program assures that all Pennsylvania residents and visitors are protected from microbiological, chemical and radiological contaminants in drinking water. Under the 1905 Public Water Supply Law, Pennsylvania led the nation in waterborne disease outbreaks, averaging eight to ten per year. Today, under the 1984 Safe Drinking Water Act, DEP regulates over 9,700 public water systems serving more than ten million people. Through improved source water protection and water quality regulation, waterborne disease outbreaks are now a very rare occurrence in Pennsylvania's public water systems.
The success of Pennsylvania's drinking water program is attributed to a combination of the following activities within DEP:
- Source Water Assessment and Protection (visit our SWAP Web page)
- Permitting, inspections, compliance and enforcement
- Regulation, policy and guidance development
- Design standards development
- Operator training and certification programs
- Specialized technical / managerial assistance and outreach programs
- Financial assistance to construct and maintain infrastructure
- Specialized facility inventory and compliance data systems
The following summary, dated April 2008, contains information on the benefits, outputs and outcomes of Pennsylvania's safe drinking water program. For a detailed report on DEP's specialized filter plant programs, view the performance measures Web page for these programs. You may also wish to visit our Drinking Water Information Web page.
Public Water System Information
For general information on public water systems, visit the U.S. Environmental Protection Agency's groundwater and drinking water Web page.
Below, Figures 1 through 4 provide information on the number of public water systems in various categories. Three of the graphs present information by population group for each type of water system. Water system types include community (CWS), transient noncommunity (TNC), and nontransient noncommunity (NTNC). The population size categories are small (25 to 3,299 people), medium (3,300 to 49,999 people), and large (at least 50,000 people). The fourth graph shows water system type and whether the systems obtain water from groundwater or surface water sources.
For the noncommunity water systems, nearly all systems are in the small population size group (25 to 3,300 people). Likewise, 85% of the community systems are the small group. A downward trend is apparent for all water system types. Transient noncommunity water systems have a more pronounced downward trend than the other two groups. In the past, many transient systems such as schools, service stations, restaurants, and hotels/motels were once in outlying rural areas and operated their own water system. More recently, many have interconnected to nearby community water systems. The slight downward trend for community water systems may be explained by some larger systems taking over smaller systems.
Over 9 million people 75% of the Commonwealth's total population receive some or all of their drinking water from 575 public water systems that use surface water sources or groundwater sources under the direct influence of surface water. By comparison, 94% of the water systems in the state obtain water from groundwater sources but serve a total of 2.8 million people.
Figure 1. Community Water Systems - By Population Group
| |
1994 |
1995 |
1996 |
1997 |
1998 |
1999 |
2000 |
|---|
| CWS Large |
30 |
30 |
30 |
32 |
30 |
30 |
30 |
| CWS Med. |
277 |
282 |
284 |
282 |
291 |
287 |
291 |
| CWS Small |
2009 |
1982 |
1962 |
1938 |
1911 |
1900 |
1880 |
| |
2001 |
2002 |
2003 |
2004 |
2005 |
2006 |
2007 |
|---|
| CWS Large |
30 |
31 |
31 |
31 |
31 |
32 |
32 |
| CWS Med. |
290 |
292 |
291 |
291 |
294 |
294 |
296 |
| CWS Small |
1864 |
1848 |
1846 |
1812 |
1787 |
1781 |
1763
|
Figure 2. NonTransient NonCommunity Systems - By Population Group
| |
1994 |
1995 |
1996 |
1997 |
1998 |
1999 |
2000 |
|---|
| NTNC Large |
0 |
0 |
0 |
0 |
0 |
0 |
0 |
| NTNC Med. |
5 |
5 |
6 |
6 |
6 |
8 |
8 |
| NTNC Small |
1439 |
1326 |
1299 |
1273 |
1258 |
1256 |
1258 |
| |
2001 |
2002 |
2003 |
2004 |
2005 |
2006 |
2007 |
|---|
| NTNC Large |
0 |
0 |
0 |
0 |
0 |
0 |
0 |
| NTNC Med. |
8 |
9 |
11 |
12 |
12 |
12 |
12 |
| NTNC Small |
1260 |
1244 |
1220 |
1208 |
1177 |
1152 |
1163
|
Figure 3. Transient NonCommunity Systems - By Population Group
| |
1994 |
1995 |
1996 |
1997 |
1998 |
1999 |
2000 |
|---|
| TNC Large |
0 |
0 |
1 |
1 |
0 |
0 |
0 |
|---|
| TNC Med. |
11 |
12 |
10 |
10 |
10 |
9 |
7 |
| TNC Small |
7017 |
7087 |
7143 |
7082 |
7044 |
6971 |
6921 |
| |
2001 |
2002 |
2003 |
2004 |
2005 |
2006 |
2007 |
|---|
| TNC Large |
0 |
0 |
0 |
0 |
0 |
0 |
0 |
| TNC Med. |
6 |
6 |
7 |
7 |
8 |
8 |
8 |
| TNC Small |
6811 |
6712 |
6632 |
6558 |
6476 |
6354 |
6302
|
Figure 4. Water System Type and Source Water
| |
1994 |
1995 |
1996 |
1997 |
1998 |
1999 |
2000 |
|---|
| NTNC - ground |
1420 |
1304 |
1278 |
1253 |
1240 |
1242 |
1244 |
| NTNC - surface |
23 |
26 |
27 |
25 |
24 |
22 |
22 |
| TNC - ground |
6988 |
7054 |
7107 |
7047 |
7010 |
6926 |
6869 |
| TNC - surface |
39 |
41 |
43 |
45 |
42 |
53 |
58 |
| CWS - ground |
1834 |
1830 |
1818 |
1789 |
1773 |
1735 |
1717 |
| CWS - surface |
482 |
464 |
458 |
463 |
458 |
480 |
483 |
|
2001 |
2002 |
2003 |
2004 |
2005 |
2006 |
2007 |
|---|
| NTNC - ground |
1245 |
1229 |
1206 |
1195 |
1167 |
1138 |
1152 |
| NTNC - surface |
22 |
24 |
24 |
25 |
22 |
26 |
25 |
| TNC - ground |
6761 |
6659 |
6574 |
6500 |
6419 |
6297 |
6244 |
| TNC - surface |
55 |
57 |
65 |
62 |
64 |
65 |
64 |
| CWS - ground |
1703 |
1680 |
1677 |
1643 |
1626 |
1622 |
1616 |
| CWS - surface |
481 |
490 |
491 |
491 |
486 |
485 |
475
|
Pennsylvania is ranked 7the in total drinking water system infrastructure financing needs, according to the 2003 US Environmental Protection Agency Needs Survey. In this survey, the total identified financial need for Pennsylvania was $10.990 billion. A number of new treatment requirements to further protect public health and safety will add to the need for additional infrastructure in the next ten to fifteen years. In addition, existing infrastructure is aging and will need to be replaced. Figure 5 shows the categorical breakdown of the estimated financing needs as of 2003.
Figure 5. Pennsylvania Drinking Water Infrastructure Needs (2003)
Insufficient state and federal financial resources are available to meet the existing much less future funding needs for constructing, upgrading and maintaining Pennsylvania's infrastructure. These resources need to be maximized through appropriate customer rate structures and local capital planning and budgeting. A number of federal and state financial resources provide low interest loans and grants for Pennsylvania's drinking water infrastructure. These resources have different requirements and eligibility conditions. Additionally, DEP offers training and outreach resources to provide local officials with the necessary managerial and financial tools to plan for the future and insure the long-term sustainability of their water system.
Drinking Water Program Outputs
Below, four graphs and one table provide information relating to the statewide output of the drinking water program, including Permits, Inspections, Enforcement Actions, Penalties and Capability Enhancement. For more information, read DEP's Drinking Water Compliance Report for each calendar year.
Output/Status #1.
DEP staff processed 732 permits across the state in calendar year 2007.
Under the provisions of Chapter 109 Safe Drinking Water, no person may construct or operate a public water system without first obtaining a permit from DEP. Furthermore, no person may substantially modify a water system that is operated under a permit without first obtaining a permit amendment from DEP. Figure 6 shows that, on average, DEP processes approximately 750 permits each calendar year.
Figure 6. Permits Processed in Each Calendar Year
| |
1998 |
1999 |
2000 |
2001 |
2002 |
2003 |
2004 |
2005 |
2006 |
2007 |
|---|
| State-wide Permits |
711 |
754 |
784 |
731 |
806 |
681 |
928 |
612 |
747 |
732
|
Output/Status #2.
DEP staff conducted 2,776 inspections across the state in calendar year 2007.
DEP's technical field staff conduct several types of inspections at public water systems. A complete or full inspection, also known as a sanitary survey, examines all aspects of the system. These inspections occur every three to five years. Figure 7 shows a drop in the number of inspections in the late 1990's, when efforts were shifted from field work to the implementation of new federal regulations on disinfection byproducts and surface water treatment. The graph nearby shows that, on average, DEP conducts approximately 3,250 inspections each calendar year.
Figure 7. Inspections Conducted in Each Calendar Year
| |
1998 |
1999 |
2000 |
2001 |
2002 |
|---|
| State-wide Inspections |
4769 |
4554 |
3177 |
2656 |
2873 |
| |
2003 |
2004 |
2005 |
2006 |
2007 |
|---|
| State-wide Inspections |
2613 |
2644 |
3013 |
2803 |
2776
|
Output/Status #3.
DEP staff completed 8,476 enforcement actions across the state in calendar year 2007.
DEP is authorized under the Pennsylvania Safe Drinking Water Act (Act) and other environmental statutes and regulations to take actions it deems necessary for effective enforcement. DEP's technical field staff may take enforcement action against a public water system during on-site inspections or in response to self-monitoring violations. Figure 8 reveals an increased number of enforcement actions due to the growing complexity of regulations and the increased number of regulated contaminants. On average, DEP takes approximately 6,375 enforcement actions each calendar year.
Figure 8. Enforcement Actions Taken in Each Calendar Year
| |
1998 |
1999 |
2000 |
2001 |
2002 |
|---|
| State-wide Enforcements |
4316 |
4626 |
5731 |
5785 |
6845 |
| |
2003 |
2004 |
2005 |
2006 |
2007 |
|---|
| State-wide Enforcements |
5768 |
8177 |
9560 |
9647 |
8476
|
Output/Status #4.
DEP staff assessed 91 penalties in the state in calendar year 2007.
Under the Act, DEP is authorized to assess and collect civil penalties, fines, and/or other fees for each violation. A penalty may be assessed whether or not the violation is willful or negligent. Figure 9 shows the number of penalty actions performed across the state has averaged approximately 28 per calendar year.
Figure 9. Penalties Assessed in Each Calendar Year
| |
1998 |
1999 |
2000 |
2001 |
2002 |
|---|
| State-wide Penalties |
27 |
20 |
39 |
22 |
17 |
| |
2003 |
2004 |
2005 |
2006 |
2007 |
|---|
| State-wide Penalties |
25 |
30 |
42 |
67 |
91
|
Output/Status #5.
Statewide, DEP has provided on-site, hands-on technical, managerial and financial capability enhancement assistance to an average of over 50 drinking water systems per year in the past six years.
These compliance assurance activities are provided as part of the Capability Enhancement, Outreach Assistance Provider and Engineering Services Programs. Activities are accomplished through contract agreements with an engineering firm, non-profit industry associations, and certified operators of water systems who work part-time for DEP. Table 1 shows a summary of the number of systems that initiated participation in the programs each year.
Table 1. Number of Systems Receiving On-Site Assistance
| PROGRAM |
2000 |
2001 |
2002 |
2003 |
2004 |
2005 |
|---|
| Capability Enhancement |
|
34 |
40 |
27 |
13 |
18 |
| Engineering Services |
7 |
22 |
4 |
6 |
3 |
1 |
| Drinking Water Outreach Assistance |
|
44 |
27 |
8 |
29 |
26 |
| TOTAL |
7 |
100 |
71 |
41 |
45 |
45
|
For information on the Outreach Assistance Provider Program visit the On-Line Technical Assistance page.
Output/Status #6.
In the past six years, an average of 72 drinking water systems have received $540 million through a number of different loan and grant programs.
Programs that provide financial assistance include the Pennsylvania Infrastructure Investment Authority (PENNVEST) Program, the Federal Drinking Water State Revolving Loan Fund Programs, the Growing Greener Innovative Technology Grant Program, the Growing Greener Drinking Water and Wastewater Treatment Infrastructure Construction and Enhancement Program and the Federal Special Appropriations Program, and State Safe Water Grant Program. DEP staff members work with DEP regional staff, PENNVEST, the Environmental Protection Agency and local officials to facilitate the coordination and implementation of these funding programs. Table 2 shows a summary of the drinking water systems that have received assistance since the year 2000, and Table 3 provides the amount of funding.
Table 2. Number of Drinking Water Systems Receiving Financial Assistance
| Program |
2000 |
2001 |
2002 |
2003 |
2004 |
2005 |
|---|
| PENNVEST (State $) |
14 |
28 |
35 |
15 |
19 |
11 |
| State Revolving Loan Fund |
37 |
11 |
16 |
14 |
10 |
18 |
| Growing Greener Innovative Technology Grants |
11 |
0 |
0 |
2 |
1 |
5 |
| Federal Special Appropriations |
5 |
4 |
4 |
4 |
9 |
8 |
| Safe Water Grant |
3 |
9 |
44 |
28 |
25 |
40 |
| Growing Greener 2 |
|
|
|
|
|
0 |
| TOTAL |
70 |
52 |
99 |
63 |
64 |
82
|
Table 3. Amount of Funding Received by Drinking Water Systems
| Program |
2000 |
2001 |
2002 |
|---|
| PENNVEST (State $) |
17,890,902 |
67,220,153 |
56,217,080 |
| State Revolving Loan Fund |
61,763,658 |
58,167,030 |
48,105,625 |
| Growing Greener Innovative Technology Grants |
1,094,000 |
0 |
0 |
| Federal Special Appropriations |
6,269,248 |
1,742,000 |
2,407,100 |
| Safe Water Grant |
2,375,000 |
1,640,000 |
3,303,769 |
| TOTAL $ |
89,392,808 |
128,769,183 |
110,030,574 |
| Program |
2003 |
2004 |
2005 |
|---|
| PENNVEST (State $) |
50,175,308 |
31,265,878 |
10,491,540 |
| State Revolving Loan Fund |
34,260,957 |
25,926,287 |
45,144,596 |
| Growing Greener Innovative Technology Grants |
347,770 |
6,750 |
1,572,303 |
| Federal Special Appropriations |
1,674,000 |
2,568,000 |
1,804,050 |
| Safe Water Grant |
1,913,785 |
1,975,000 |
3,086,069 |
| TOTAL $ |
88,371,820 |
61,741,915 |
62,098,558
|
For general information, visit the Municipal Finance Information Web page. For PENNVEST information, visit the Pennsylvania Infrastructure Investment Authority Web page. New and Innovative Water Technology information is available on a special Web page.
Drinking Water Program Outcomes
Below, six graphs provide information on the number of violations at public water systems. These violations reflect the health risks associated with public drinking water and, to a large degree, reveal if DEP's Safe Drinking Water Program is reducing risks for Pennsylvania residents and visitors.
Safe drinking water regulations specify water testing methods and the schedules for the frequency of testing. Safe drinking water regulations also require monitoring for almost 100 contaminants depending on the type of water system, treatment, source water and population served. On average, water systems across the state monitor and report a total of nearly a half million analytical results to DEP during the year.
Click on each item below to obtain a definition of these contaminant groups:
For more information on violations, read DEP's Drinking Water Compliance Report for each calendar year. For morehealth effects information, visit the U.S. Environmental Protection Agency's drinking water and health Web site.
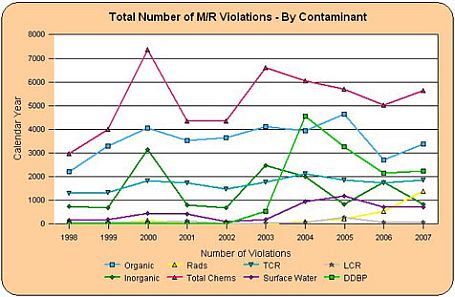
Outcome #1.
Statewide, monitoring and reporting violations have trended upward since the late 1990's.
A monitoring / reporting (M/R) violation is not necessarily a health threat; rather, this type of violation is indicative of whether water systems have correctly monitored and reported data to DEP. A water system that does not follow the monitoring schedule, sampling or analytical methodology, or reporting requirements may incur an M/R violation. Due to the growing complexity of regulations and the increased number of regulated contaminants, the number of systems with M/R violations grew in 2003 and 2004 but decreased in calendar year 2005 (see Figures 10 and 11).
Figure 10. Number of Systems with M/R Violations - By Contaminant
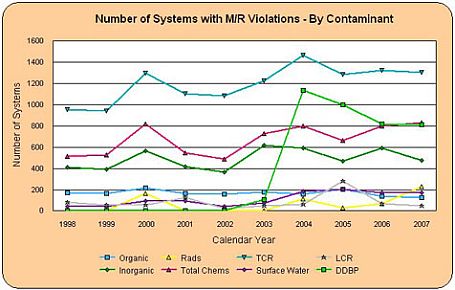
Figure 11. Total Number of M/R Violations - By Contaminant
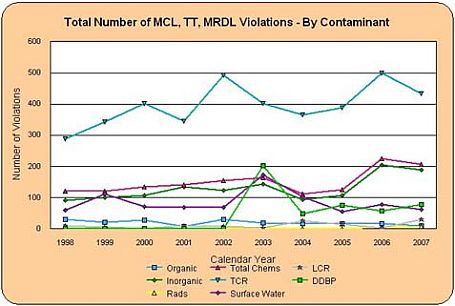
Outcome #2.
In 2005, violations across the state remained relatively flat after peaking in 2002 and 2003.
The violation types in Figures 12 and 13 include the Maximum Contaminant Level (MCL), Maximum Residual Disinfectant Level (MRDL), and Treatment Technique (TT). Click on these words to obtain definitions. Due to the growing complexity of regulations and the increased number of regulated contaminants, the number of systems in violation grew in 2002 and 2003 but have remained relatively flat over the past two calendar years.
Figure 12. Number of Systems with MCL, TT, MRDL Violations - By Contaminant
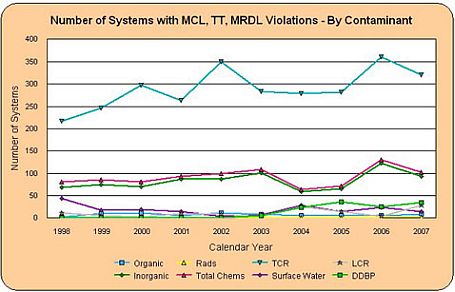
Figure 13. Total Number of MCL, TT, MRDL Violations - By Contaminant
Outcome #3.
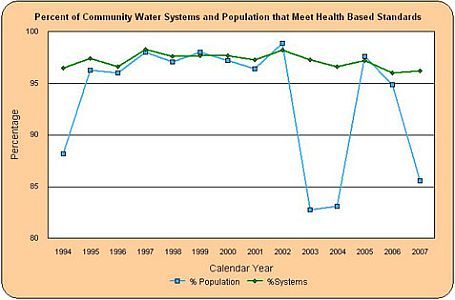
Last year, nearly 100 percent of the community water systems and the population they served met health-based standards.
A "Health-Based Standards" chart is another way to measure program outcomes. The graph is created from valid violations for 22 violation types. The graph shows the percentage of community water systems and the percentage of the population served by these systems that have experienced no violations. Figure 14 reveals relatively stable yearly percentages. The population downturns in 2003 and 2004 occurred when new regulations (Disinfectants/Disinfection Byproducts Rule) become effective. Because the population served weights the graph, a few systems with very large populations can have an exaggerated effect. In both years, some large water systems experienced violations that abnormally affected this curve.
Figure 14. Percentage of Community Water Systems and Populations that Meet Health Based Standards
Outcome #4.
Waterborne disease outbreaks associated with public drinking water remain low in Pennsylvania.
Pennsylvania once led the nation in the number of reported waterborne disease outbreaks. On October 22, 2004, the U.S. Centers for Disease Control and Prevention and the U.S. Environmental Protection Agency released the latest disease information in a summary titled "Surveillance for Waterborne-Disease Outbreaks" in their Morbidity and Mortality Weekly Report. According to the report, waterborne disease outbreaks in the state remain low (Figures 15 and 16). Many initiatives in Pennsylvania's Safe Drinking Water Program that have reduced our disease outbreaks. For a more detailed summary of waterborne disease information, visit our waterborne disease Web page.
Figure 15. Number of Water Borne Disease Outbreaks
| |
1998 |
1999 |
2000 |
2001 |
2002 |
2003 |
2004 |
2005 |
2006 |
2007 |
|---|
| Outbreaks |
0 |
0 |
0 |
1 |
0 |
0 |
2 |
0 |
0 |
0
|
Figure 16. Number of Water Borne Disease Cases
|
1998 |
1999 |
2000 |
2001 |
2002 |
2003 |
2004 |
2005 |
2006 |
2007 |
|---|
| Cases |
0 |
0 |
0 |
19 |
0 |
0 |
244 |
0 |
0 |
0
|